Course element Survey
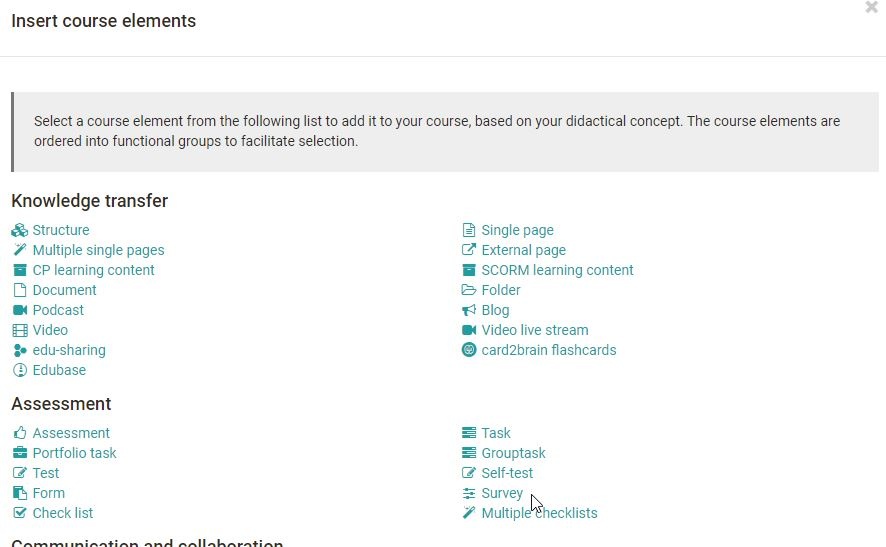
In order to use questionnaires or surveys, they have to be integrated into an OpenOlat course. For this purpose, the course element "Survey" has to be added in the course editor and either an already existing learning resource "Form" (formerly survey) has to be integrated or a new form has to be created (see also 4 steps to your questionnaire).
It can then be defined who can participate in the survey and who can see the results of the survey. The following options can be selected:
Participation:
- the owners of the course
- the coaches of the course
- the participants of the course: All persons registered in the role "Participants" in the course
- guests: Persons without OpenOlat Account
If the advanced configuration is activated, further settings can be made, e.g. certain periods of participation for certain roles and participation for certain groups can be defined.
Also the results can be released for all these groups and linked to a start and end date in the advanced configuration.
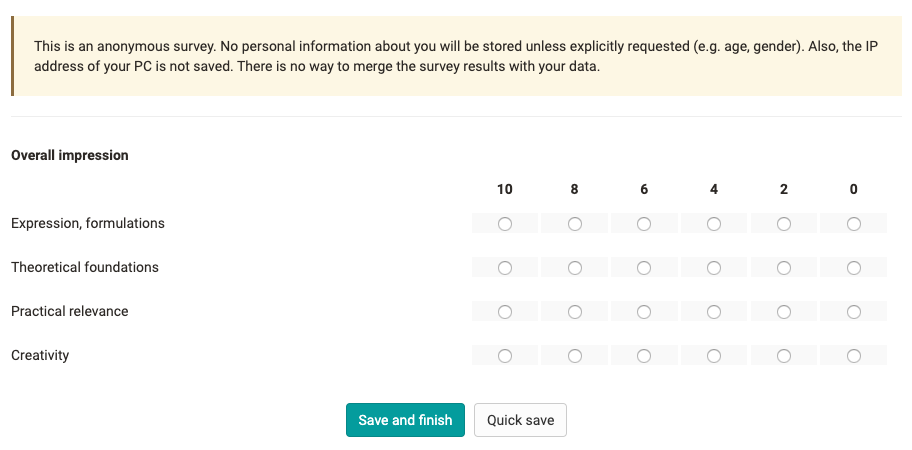
From the learner's view, the survey is directly visible when it calls up the survey in the left-hand navigation.
The survey can only be completed once and cannot be changed after it has been sent. If you do not want to send the questionnaire directly, you can use the "Save as" option.
Survey results
The results of a survey are presented in the course run as follows and are identical for all persons who can view the results. In addition, course owners can also "reset" a completed questionnaire. In this case, all questionnaires already submitted will be deleted.
The following evaluation tabs are available:
| Overview | Here you can find out how many people filled out the questionnaire, the submission period and the processing time. Depending on the type of question, other key figures may also be listed. |
| Tables | Here you can see the individual questions and answers as well as further statistical evaluations at Rubrics. Free texts can also be downloaded as Excel tables. |
| Diagrams | The Diagrams tab shows a graphical representation of the individual questions and answers. |
| Individual questionnaires | Here one has access to the entire filled out, anonymous questionnaires of individual persons. |
Furthermore, the contents of all 4 tabs can also be printed out or downloaded as an Excel table or as a PDF version. A reset can be achieved by clicking on the 3-dots.
The same evaluation can also be found in the menu "Administration" -> "Survey statistics". Only a reset is not possible here.
Another way to save the results is via the menu "Data Archiving" -> "Surveys". This is the same file as under "Export" in the course run.
If a questionnaire is integrated into a course as a survey, the questionnaire can be changed in the course to a limited extent using the "Edit" button. Texts can be changed but individual blocks can no longer be moved or new areas created or deleted. The weighting of a category can still be changed.


